Bergen Geoanalytical Facility (BGF)
The main goal of BGF is to serve fundamental and applied research in elemental and isotope geochemistry and analytical chemistry for scientists from academic and government institutions, private companies and industry.
Hovedinnhold
Raman Spectometry
The Raman spectroscopy analytical facility consist of a confocal Raman spectrometer attached to a petrographic microscope with motorized mapping stage. This setup contains three different lasers and two detectors, which allows for Raman spectroscopy and Photoluminescence detection in the visual (VIS) and near-infrared (NIR) range. Possibly our scope of analysis will be extended in the future with detection in the ultraviolet range (UV).
The instrument consist of the following components:
- Raman spectrometer with VIS-CCD camera
- Petrographic microscope and motorized mapping stage
- Resolution x,y better than 1 um
- Resolution z better than 2.5 um
- High speed mapping and depth profiling capability
- Argon laser 488 nm and 514 nm wavelength
- Diode-laser 785 nm wavelength
- Statistical software for background subtraction and peak fitting
- Statistical software for PCA and map construction
- Peak identification software
- Spectral databases for minerals, inorganic and organic substances
Raman Spectroscopy - Theory:
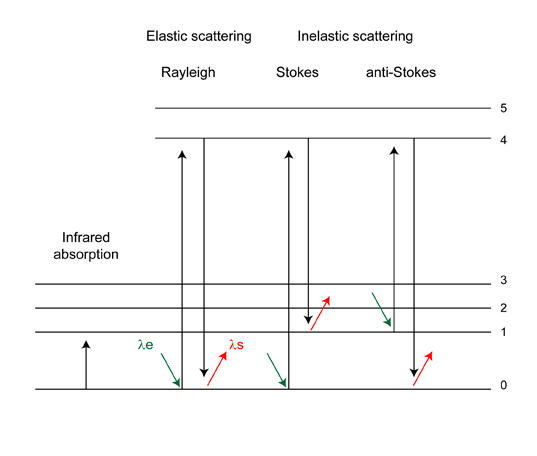
The Raman effect, named after Noble price winner Chandrasekhara Venkata Raman, can be described as an inelastic light scattering process. When a strong light source (laser) is focused on a substance most of this energy will be scattered elastically. In this case the molecules of the substance are excited to a virtual electronic state and immediately fall back to their original state by releasing a photon (see figure 1). The photon energy of this scattered light is equal to that of the incoming light. This process is called Rayleigh scattering. A molecule may also fall back from an excited electronic state to an energy state that is higher (Stokes type scattering) or lower (anti-Stokes type scattering) than the original state. The difference in energy between the incoming and scattered photon (Raman shift) corresponds to the energy difference between vibrational energy levels of the molecule. The different vibrational modes of a molecule can therefore be identified by recognizing Raman shifts (or ‘bands’) in the inelastically scattered light spectrum.
Figure 1. Simplified energy level diagram. The shift in wavelength between the excitation light (λe) and the scattered light (λs) is related to Raman shift (ΔV in cm-1) according to: ΔV = (1/ λe) + (1/ λs).
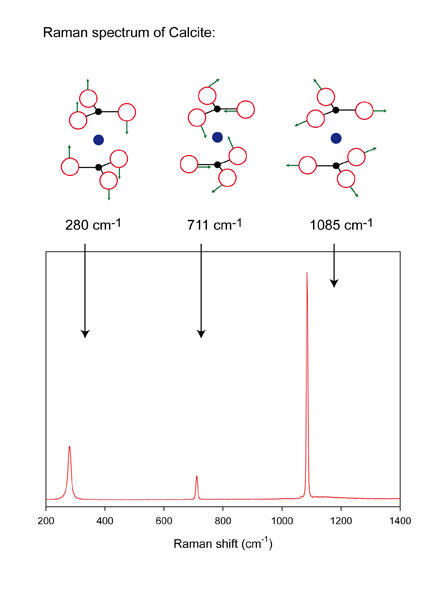
A wide variety of substances – minerals, organic molecules, fluids, gases – can be identified directly from their Raman spectrum. It should be noted that Raman scattering is effective for covalent bonds, and very weak for ionic bonds. The covalent bonding environment can be influenced by cation substitution in a mineral structure. An example for the mineral calcite is shown in figure 2, where Raman bands are generated by vibrational modes of the carbonate anion.
Figure 2. The Raman spectrum of Calcite and some of the associated normal vibrations of the crystal structure are shown.
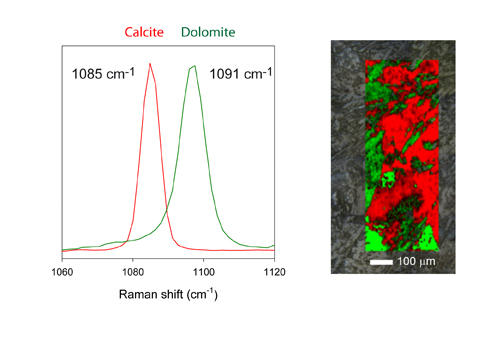
The substitution of Mg for Ca in the carbonate structure, e.g. dolomite, leads to an altered crystal structure and a shift of the main Raman band from 1085 to 1091 cm-1. This difference in Raman shift can be mapped in a rock thinsection, as shown in figure 3.
Figure 3. Example of a Raman map using fast x,y-Raman scanning. This map consists of thousands of spectra, and was generated within a few minutes.
As vibrational energy is directly related to molecular bond strength, many additional molecular characteristics can be studied by Raman spectroscopy. These include:
-Stress patterns in minerals
-Qualitative recognition of stable isotopes (e.g. 13C-labelling)
-Breathing-modes of carbon nanotubes
-Degree of structural order in kerogen and graphite.
For further reading see:
Nasdala, L., Smith, D. C., Kaindl, R., and Ziemann, M. A., 2004. Raman spectroscopy: Analytical perspectives in mineralogical research. In: Beran, A. and Libowitzky, E. (Eds.), Spectroscopic Methods in Mineralogy. Eötvös University Press, Budapest. European Mineralogical Union, Notes in Mineralogy, Vol. 6.


