Overview
The visualization group at the UiB Department of Informatics in Bergen, Norway, researches new visualization solutions for users from different domains to enable the effective and efficient exploration, analysis, and/or presentation of data.
Main content
Datasets usually result from experimental measurements (e.g., medical image acquisition with computer tomography or seismic measurements), computational simulation (e.g., computational fluid dynamics simulation), or theoretical modeling (e.g., dynamical system modeling).
User goals include the
- presentation of valuable information to others (e.g., in a collaborative setting or for dissemination),
- the analysis of concrete hypotheses to either corroborate or to reject them (e.g., during medical diagnosis or when analyzing a new design in engineering), and
- finding new, possibly unexpected information (e.g., in the exploration of trends and outliers).
Visualization research can be categorized, e.g.,
- by distinguishing between usage domains (e.g., medical visualization, flow visualization, etc.) or
- by opposing visualization technologies (e.g., interactive visual analysis, illustrative visualization, etc.).
Here we provide an overview of our research with respect to both of these two categorizations.
Visualization for...
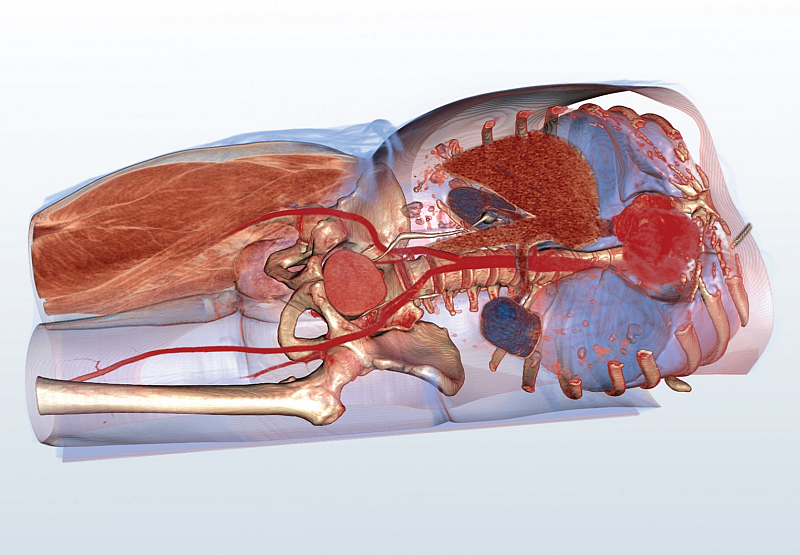
Medicine
We research new visualization approaches to support medical diagnosis, surgery planning, and other medical procedures.
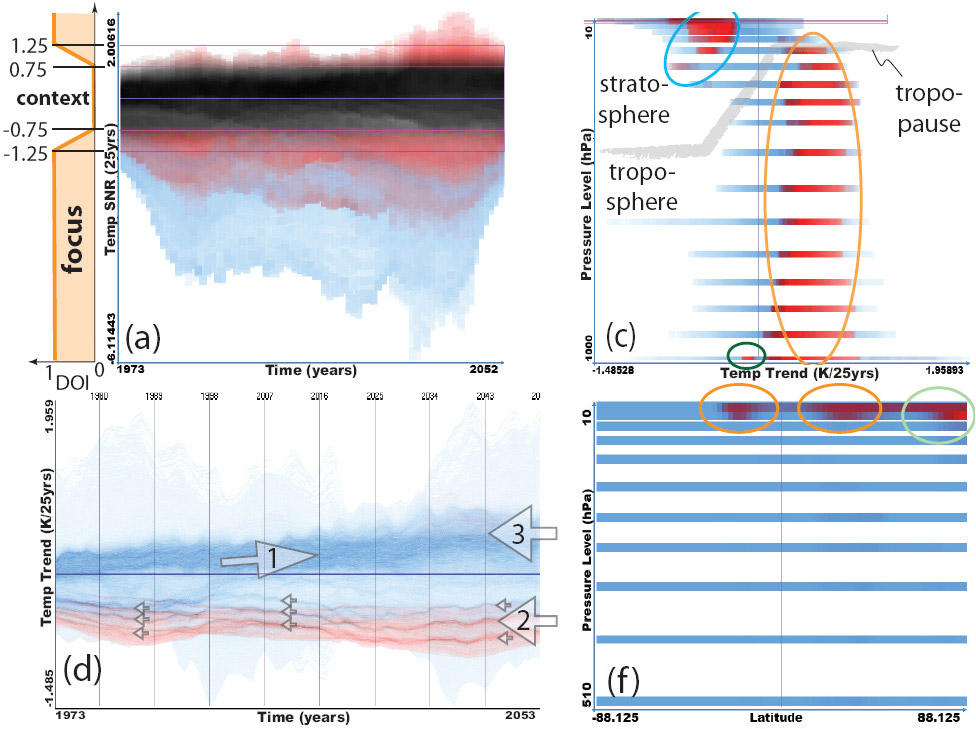
Climate Research & Meteorology
Visualization research is targeted at supporting the analysis of time-dependent data from 3D simulations of climate and weather.
Oil & Gas Extraction
Our research is oriented at the needs for interpreting large seismic datasets and for 3D inspections to support hole drilling, aso.
Molecular Biology
Interactive 3D visualization helps to better understand the complex structure of large proteins as well as their dynamics.
Visualization by...
Interactive Visual Analysis
Interactive visual analysis (aka "visual analytics") is provided to enable iterative information drill-down in complex data exploration scenarios.
Illustrative Visualization
Illustrative visualization utilizes a variety of different styles to enable focus+context visualization with respect to user preferences.
GPU-based Visualization
The utilization of modern graphics hardware allows interactive visualization of large datasets as unseen before.