Drawing your year
Portraying a year.


Hovedinnhold
Background
There is a long tradition in the social sciences and humanities – from anthropology to sociology or natural resource management – of asking individuals and groups to ‘draw their seasonal year’ (see e.g. Bourdieu’s classic ‘Outline of a Theory of Practice’, and a collection of essays about representing the year).
Drawing the year helps people visualise and make explicit their taken-for-granted temporal structure of the year; the events, signs and rhythms that mark the passing of the year, and the way their activities are divided into seasons, workweeks, holidays, and so on. Drawing the year helps study, compare and make sense of peoples diverse frameworks for organising time, and the ways they may be evolving. Producing a visual record of the year also enables people to play with and reorganise frameworks; to change timings.
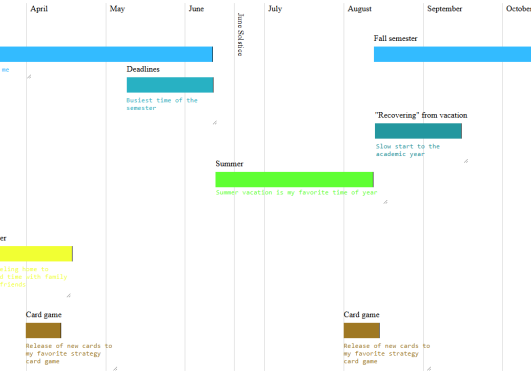
What is clear is that people conceive of the (seasonal) year in dramatically different ways. Asking people to draw the "shape" of their year can yield surprising results, as seen in a study organised by a Norwegian newspaper.
The visual representation of time is highly cultural, so that in European traditions the year is often drawn as a circle like a clock, with each of the 12 Gregorian months corresponding to a number on the clock. But other representations abound, from graphs to mobius strips, landscape maps, sundials, rhombus and other more irregular (amoebic-like) shapes.
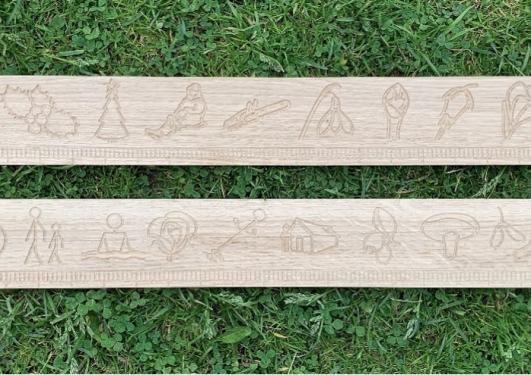
Other studies have tried to access other (indigenous) cultural representations of the year, such as the "cold-fire" calendar of Indigenous Australians, marked by the life-cycles of plants and animals, or the Anishinabek Nation "turtle calendar", read from the 13 segments of a snapping turtles shell, each corresponding to one of the 13 moons in their lunar calendar.
One common distinction across calendars, for example, is between seasons as concrete "blocks" of time with hard boundaries, or seasons as rhythms or cycles that flow through the year.
Objectives
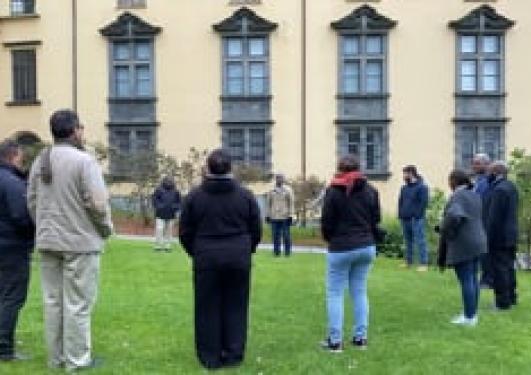
- To invite individuals and groups to reflect on how they perceive the temporal organisation of a seasonal year through drawing it (using different media).
- To compare and contrast the diverse ways of visually representing the year, for an appreciation of the different ways of seeing and acting "on time".
- To discover what (if anything) is common across diverse visualisations of the year, as shared temporal reference points that people coordinate around.
See downloadable instructions in English and Norwegian below.